
What is Napkin?
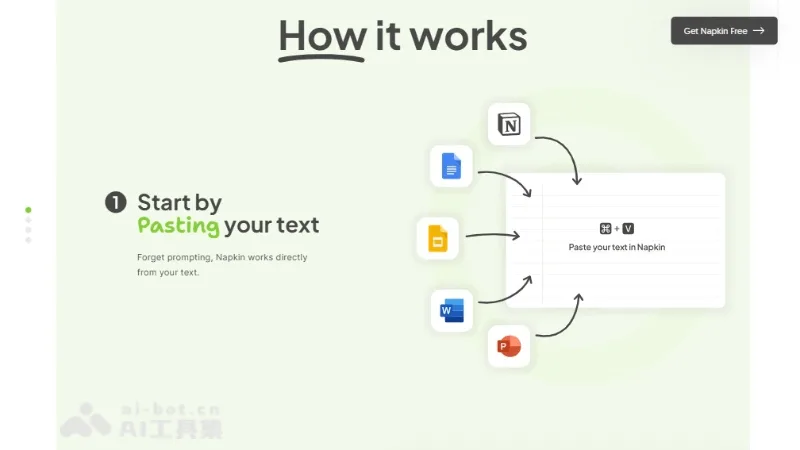
Napkin AI generates visual representations around textual content. Users can directly type, paste, or import materials, then choose flowcharts, mind maps, infographics, or data charts that best suit the information’s relationships—focusing on organizing existing content to make it easier to understand, without needing to first craft complex drawing prompts.
The generated elements can be further customized, including color, font, icons, layout, and individual shapes. The creations can be embedded in presentations, documents, reports, or social media content; the platform also features a Napkin Slides presentation hub and offers shared team spaces, collaborative editing, and annotated feedback.
The availability of PNG, PDF, PPT, and SVG formats varies depending on the plan; free visual assets carry the Napkin brand. On mobile, you can view existing creations and create or edit presentations, but the official website notes that generating visual diagrams still requires a desktop device. When working with data charts, be sure to verify the original figures, categories, labels, and diagram logic before using them as official materials.
Key features
Content-to-Visualization: Flowcharts, Mind Maps, Infographics, and Data Charts.
Editable elements: color, font, icons, and layout adjustments.
Data import: PPT, DOC, PDF, HTML, and Markdown.
Collaboration and Delivery: Team Spaces, Annotations, and Export by Plan.
Use cases and audience
Professionals who need to turn written instructions into diagrams—such as office workers, teachers, researchers, and content teams.
- Organize your business processes into clear diagrams.
- Create infographics for training, reports, and presentations.
- Turn the key points of the article into social media visual content.
Text content or files in supported formats, as well as the data and logical relationships that need to be expressed.
Editable visual diagrams, presentation content, and exportable files for the plan.
How to use
- 01
Organize text or import data.
- 02
Select the content and generate an appropriate visual representation.
- 03
Modify colors, fonts, layouts, and data labels.
- 04
Verify the logic and formatting permissions, then export or embed the document.
Benefits and limitations
Benefits
- Directly generate diagrams from existing text, with the option to adjust each item individually.
Limitations
- The free plan has limitations on branding and export formats.
- Visual diagram generation is currently not supported on mobile devices.
Pricing and availability
Free entry available
500 AI credits per week, unlimited visual effects editing, unlimited file imports (PPT, DOC, PDF, HTML, MD), unlimited PNG and PDF exports, built-in styles and fonts, standard icons, with the Napkin brand logo on visuals.
Includes all features of the free plan + 10,000 AI credits per month, unlimited exports to PPT and SVG, 3 custom styles, large icons, removal of the Napkin branding, and the option to purchase additional credits.
Includes all features of the Plus plan + 30,000 AI credits per month, exclusive designs, exclusive icons, unlimited custom styles, upload your own fonts, and the option to purchase additional credits.
2026-10-24 Official plan verification: Free offers 500 AI credits per week, with unlimited editing and PNG/PDF export, while retaining branding in the visuals; after switching to monthly billing, Plus is USD 12 per user per month, with 10,000 credits per month, and Pro is USD 30 per user per month, with 30,000 credits per month. By default, the annual subscription displays a lower average monthly price than the monthly option, and additional paid seats for teams are billed separately.
- Pricing source
- https://www.napkin.ai/pricing/
- Pricing last updated
- 2026-10-24
Prices and limits may change. Check the official website for current terms.
Official website & sources
Updated on 2026-10-24